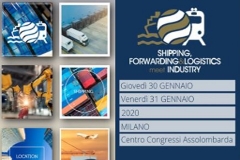
Coastal zones

Coastal zones


Land Coastal Ocean Interactions


The main objective of this case study, conducted by Planetek Italia, is the evaluation of remote sensing data in support of water quality assessment.

More precisely the interest is to demonstrate the quantitative contribution of remotely sensed data in coastal waters observations data bases, in order to move 
the use of these technologies from the useful role of qualitative estimation towards monitoring the vital activity of coastal area management.

The selected case study represents an excellent example of this approach in methodology, experimental design and results.

Phytoplankton concentration in the selected area, the Gulf of Taranto, observed in one year of CZCS observations has been processed.

Study area
The study area, represented in figure 1, has been selected in such a way to include Mar Grande and Mar Piccolo, in which most of the waste waters are discharged and part of the Ionian Sea, close which is also interested by the ILVA discharge of water. 
Moreover a larger area of the gulf have been included in order to compare the performance of the model also in open sea.
Water quality in both Mar Grande and Mar Piccolo is influenced by sensible quantities of non-treated waste water (Cardellicchio et al., 1991). 
In the western part of Mar Piccolo the ILVA steel production draws about 150,000 m3/h of water for blast furnace cooling, further disturbing the general equilibrium. This, for example, induced a considerable water flow from Mar Grande into Mar Piccolo (Caroppo et al., 1994). 
In Mar Piccolo the excess of nutrients and BOD, due to the discharges, implies distrophic effects. During summer, the water stratification inhibits oxygenation of bottom waters, thus triggering anaerobic decomposition of organic matter, with consequent production of toxic compounds. 
In pict. n.1 the area is shown together with its segmentation made using GIS techniques. Bathimetry was considered for segment dimensions taking a maximum depht of 1000 m.

Satellite data
When selecting images, main sea color instruments were analysed (see Tab.1) together with sea truth essential data availability. CZCS seemed the best for this study having a big data archive and spectral channels typical of phytoplankton.
Recent sensors such as OCTS and MOS, altough of higher spatial resolution, have not be considered beacuase of the unavaliability of sea truth data of the same time range. 
After examining the whole CZCS data archive, the range time from November 1982 to October 1983 was selected. 
Several images together with sea truth are available for that time. In pict. n.2 a July CZCS image in phytoplankton channel is displayed. 
CZCS data are available in different product level on th basis of processing level: level 1 contains the six original bands, to level 2 6 geophysical 
parameters among which phytoplankton concentration are added while in level 3 data are geocoded. 
Spatial resolution get worse rising in level: from 800 m of level 1 we find 4 km in level 2 and 18 km in level 3. 
Level two data were selected for a better spatial resolution and geocoding was carries out on them.
Image analysis
A previous analysis on phytoplancton band allows a first view on spatial distribution of phytoplankton and its seasonal variation. 
In pict. n.3 a series of study area images from january to november(no december image was available) are shown.
A phytoplancton distribution depending on currents is evident, in closer areas such as Mar Grande an accumulation appears. Very small areas such as Mar Piccolo show too high concentration values due to sensor defects or low spatial resolution. Seasonal variations match theoretical expectations increasing on summer due to higher temperatures and on winter do to upwelling phenomena.
A cinetic model to analysed water quality in response to natural and antropic effects allowed to simulate phytoplancton cycle. This program starting from an input of phytoplankton concetration taken from images, draws an annual trend respect to solar radiation, temperature and currents. It takes in account as well the occurence of other chemical species (phosfates, nitrates..) altered from urban and industrial discharges.
The study area is divided in segments having a pythoplankton value ontained from satellite images Model simulation results show a concentration increase during summer because of higher temperature and lower values on cold months. 
General trend is the same both near the coast and offshore, while in Mar Grande and Mar Piccolo values grow in magnitude maybe because of disharges. 
Two main observations turn up looking at model results: a rather smooth and uniform trend apperas near the coast and offshore. Smoothness is due to monthly average phytoplancton values which the model provides, this doesn`t allow to evidence daily variations when sharp weather changes occur. Uniformity, differing from theory, is due to lack of data related to all the segments. 
Only for phyotplancton in fact each segment had an assigned value, other parameters were constant on the whole area. These plots display simulation and image analysis results.
Conclusions
This study aimed to demonstrate the opportunity to integrate several prediction and monitoring of natural phenomena methods such as satellite image processing, simulation programs, Geographic Information Systems and sea truth data.
Results from images and model provide a rather complete analyisis on the influence of urban settlement on coastal areas state of health, using phytoplankton parameter. 
Remote sensing efficiency in monitoring of wide areas respect to traditional resources more expensive and complicated. Nonetheless satellite images allow to identify risks in short time ranges.
This study is part of ESA project Land Coastal Ocean Interactions 11972/96/NL/CN
The project was carried out by Planetek Italia, ESYS Limited e Argoss.--