

In May 2015, ISPRA presented the report of land consumption in Italy, produced with the help of maps produces by Planetek Italia. It is the first example of reuse at national level of Copernicus core downstream services.
Soil sealing (covering the ground with an artificial, impermeable material) is one of the main causes of soil degradation in the EU. According to ISPRA research, more than 7 square metres of soil are lost in Italy every second as a result of soil sealing.
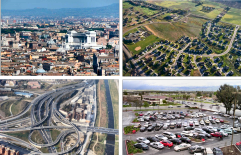 The Italian National Institute for Environmental Protection and Research (ISPRA) released a tender for mapping sealed soil areas using high resolution imagery at the national level in Italy. The aim was to build on the mapping methodology which had been applied at European level in the context of the European Environment Agency (EEA)’s High Resolution Layer on sealed soil (“Imperviousness”), developed as part of the Copernicus Land Monitoring service, to produce a new map at a resolution of 5 metres. The higher resolution makes the product also suitable for applications at a local (e.g. municipal) level.
Planetek Italia's experience in soil sealing products started in 2006 with the precursor geo-information imperviousness service within the Copernicus (then GMES) initiative of the European Commission. The first update of the imperviousness layer was done in 2009 in the frame of the geoland2 FP7 research project. Today, this service is operational, providing periodically updated maps in the frame of Copernicus Land Monitoring Service.
As a result of this activity, the company has developed a service to support the reporting on soil consumption at national and local level. The new business opportunities through national mapping initiatives.
Furthermore, Planetek is developing a procedure for the update of 5 HR layers which take advantages from the great quantity of EO data that are coming with free and open access. In particular, in order to derive a status map for the 5 HR layers, a combination of SAR and optical data is used, primarily using Sentinel-1 and Sentinel-2 data, but the methodology has been tested also using Landsat-8, RapidEye, SPOT and other data.
Links: